Longitudinal Report
The Longitudinal Report workflow combines data from multiple programming-session
TSV files for the same subject into a single comparative document. Use it
to track a patient’s progression across visits. Files must follow the BIDS
task-programming naming convention (e.g.
sub-01_ses-20250115_task-programming_run-01_events.tsv).
▶ Watch: Longitudinal report workflow overview (video)
Opening the Longitudinal View
From the home screen click Longitudinal Report.
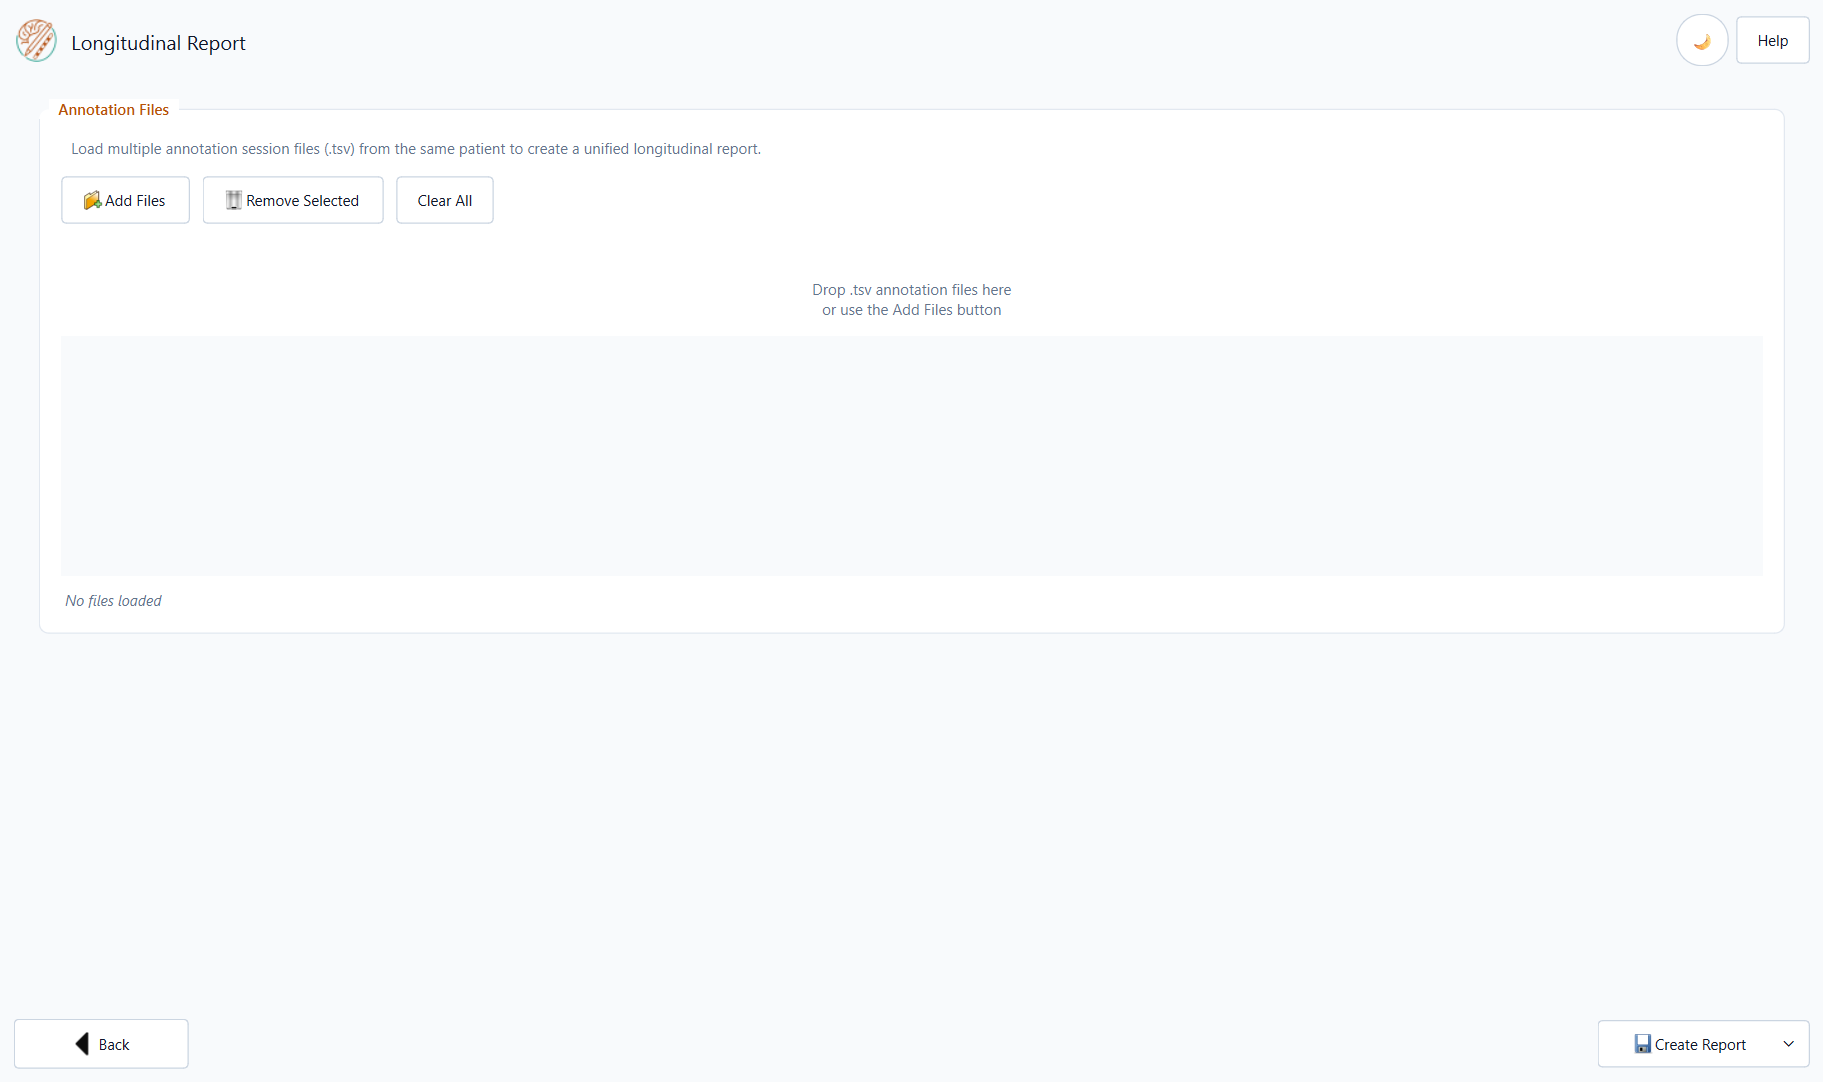
Loading Session Files
Add one or more programming-session TSV files from the same patient
(task-programming in the filename). You can load them in two ways:
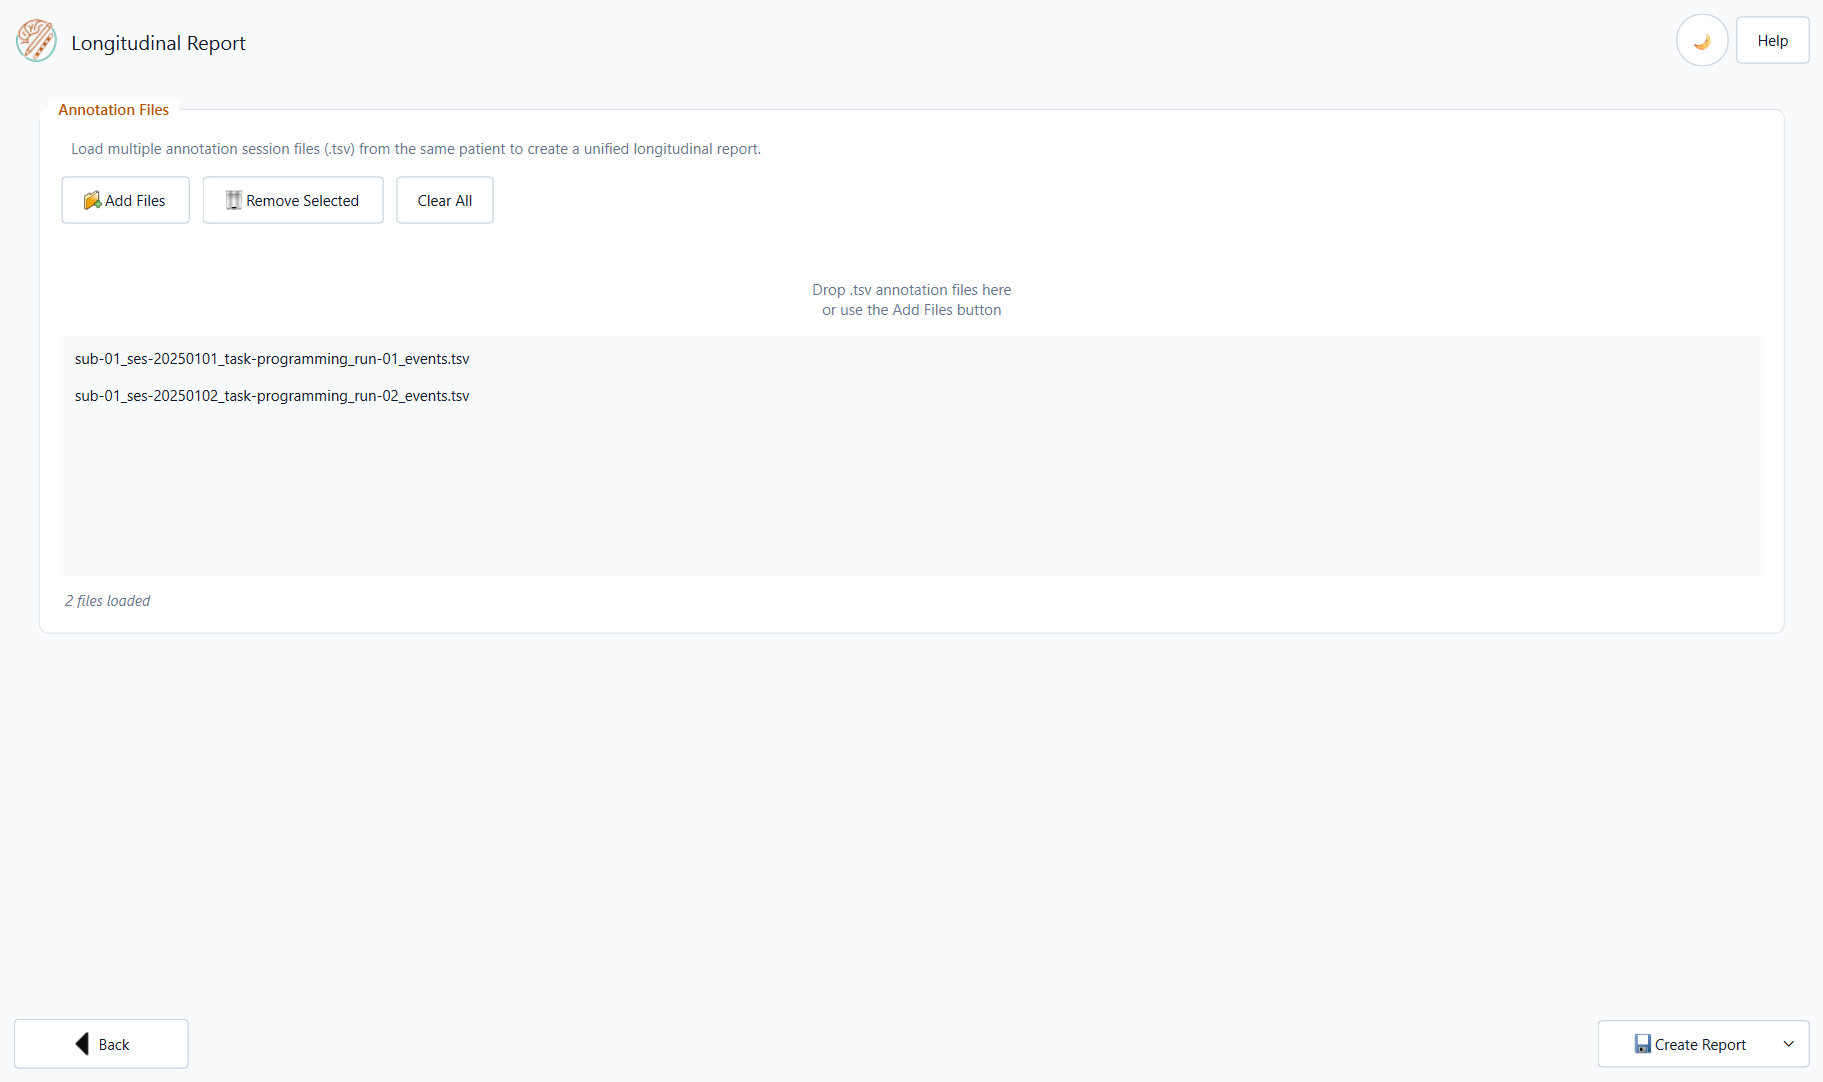
Drag and Drop
Drag one or more files from Windows Explorer directly into the file list
area of the application. Each file should match the BIDS pattern
sub-<ID>_ses-<YYYYMMDD>_task-programming_run-<NN>_events.tsv (for example
sub-01_ses-20250115_task-programming_run-01_events.tsv).
Managing the File List
Button |
Action |
|---|---|
Remove selected |
Removes the highlighted file from the list (does not delete it from disk). |
Clear all |
Removes all files from the list. |
Tip
The files are processed in the order they appear in the list. Drag rows to reorder them if needed.
Note
All files must belong to the same patient and should be programming
sessions (task-programming). The application reads the patient ID from
the BIDS filename and will warn you if files from different patients are
mixed.
Generating the Report
Click Create Report → Word Report or PDF Report.
Three dialogs appear before the file-save dialog:
Step 1 — Scale Optimisation
Choose the optimisation target for each session scale and, when present, each clinical (baseline) scale found across all loaded files.
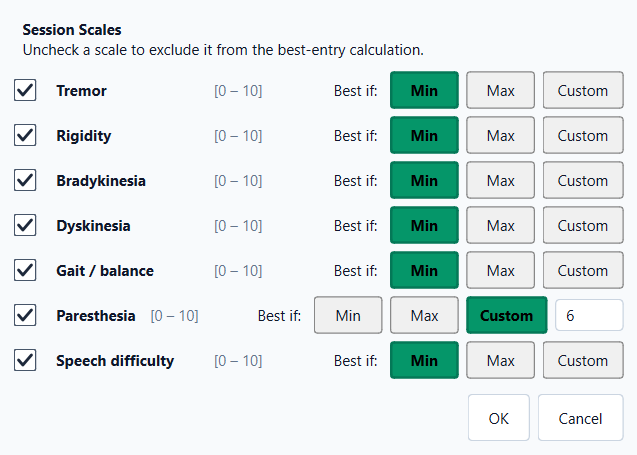
For each scale, select:
Min — lower values are better (e.g. UPDRS-III, Tremor, Y-BOCS).
Max — higher values are better (e.g. Mood, Energy).
Custom — enter a specific target value; the entry closest to that value is highlighted.
Uncheck a scale to exclude it entirely from best-entry highlighting.
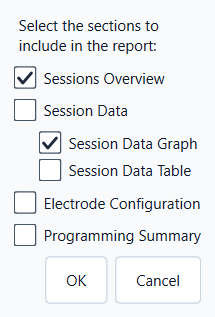
Step 2 — Report Sections
Choose which sections to include. By default Sessions Overview and Session Data Graph are checked:
Section |
Default |
Description |
|---|---|---|
Sessions Overview |
✓ |
Summary table of all loaded sessions (date, entry count, baseline clinical scales) plus a clinical scales timeline chart across sessions. |
Session Data → Graph |
✓ |
Session-scale timeline chart across all configurations in all files (one subplot per scale; best entries highlighted). |
Session Data → Table |
☐ |
Combined table of all recorded entries across sessions (date column, stimulation parameters, scale values, notes). Best entry per session highlighted. |
Electrode Configuration |
☐ |
Per-file Initial / Final electrode diagrams (Left and Right hemispheres). |
Programming Summary |
☐ |
Per-session parameter ranges (amplitude, frequency, pulse width) and number of configurations tested. |
Step 3 — Save Location
Choose where to save the generated .docx or .pdf file.
Report Contents
Sessions Overview
A clinical scales timeline chart (baseline is_initial = 1 values per
session file) followed by a summary table with one row per loaded file:
Column |
Content |
|---|---|
Session |
Filename (BIDS label) |
Date |
Date of the session extracted from the filename |
Entries |
Number of stimulation configurations recorded |
Clinical scales |
Names of baseline clinical scales recorded in Step 1 |
Values |
Corresponding baseline scores |
Session Data
Depending on your section selection, the report includes a session-scale timeline chart (values across programming blocks in all files), a combined data table, or both.
The table’s first column shows the date of each entry (from the date
field in the TSV). Other columns include laterality (L/R), stimulation
frequency, contacts (+/−), amplitude, pulse width, session scale values, and
notes. The best entry per session is highlighted in green.

Electrode Configuration
For each file, a page showing:
File / session label as a sub-heading.
Electrode model name and manufacturer.
A borderless 4-column table:
Initial — Left
Initial — Right
Final — Left
Final — Right
Contact diagram
Contact diagram
Contact diagram
Contact diagram
A page break separates each file’s configuration page.

Programming Summary
A table with one row per session showing:
Number of configurations tested
Amplitude range (Left / Right)
Frequency range (Left / Right)
Pulse width range (Left / Right)
Tips
The report can be re-generated at any time — the source TSV files are never modified.
For very long longitudinal histories (> 10 sessions) consider splitting the report into sub-periods.